Eurocharts Blog
Unlocking Project Success: The Power of Gantt Charts

Nov
Introduction
In the dynamic realm of project management, success often hinges on efficient planning, resource allocation, and timely execution. One indispensable tool that has stood the test of time is the Gantt chart. Eurocharts is a leading UK company specializing in manual planning boards and lean management solutions, harnesses the power of Gantt charts to provide a comprehensive overview of projects. In this blog post, we’ll explore what Gantt charts are, how they’re used, and why manual planning boards offer unique advantages as stand alone systems, or companions to software packages.
What is a Gantt Chart?
A Gantt chart, named after its creator Henry L. Gantt, is a powerful visual tool widely used in project management to illustrate and manage project schedules. It provides a comprehensive and accessible overview of tasks, their durations, and dependencies over time, aiding in efficient project planning and execution.
Components of a Gantt Chart
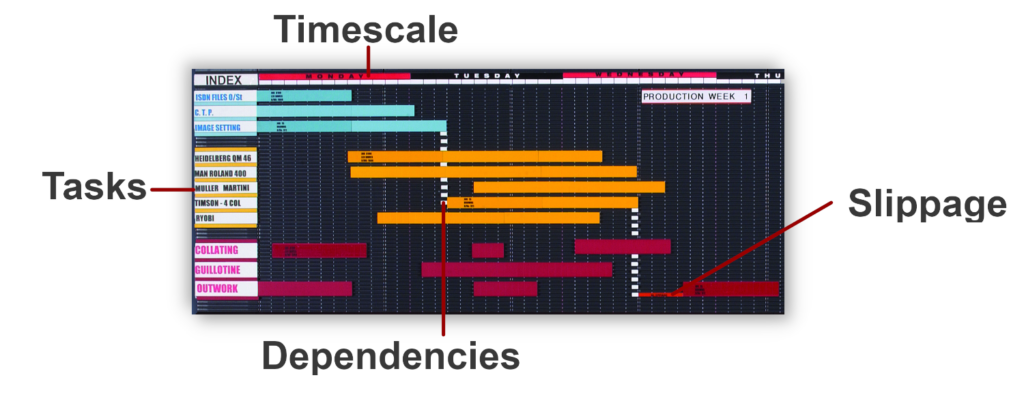
Task Bars: Horizontal bars represent individual tasks or activities. The length of each bar corresponds to the duration of the task. Easily identifiable on the timeline, these bars provide a quick reference for task duration
Timeline: A horizontal axis displays the timeline, typically in days, weeks, or months, depending on the project’s scope. Tasks are plotted along this timeline, offering a clear chronological view of the project.
Dependencies: Gantt charts allow the depiction of task dependencies. For instance, if Task B depends on the completion of Task A, the chart visually shows that Task B cannot start until Task A is finished.
Illustrative Gannt Feature Examples
Task Dependencies: Consider a software development project. Task A might be “Code Development,” and Task B could be “Testing.” The Gantt chart will illustrate that Testing cannot commence until Code Development is complete.
Downstream Effects: Suppose Task A experiences delays. The Gantt chart immediately reflects this by pushing the start time of Task B and any subsequent dependent tasks, providing a real-time understanding of the project’s status.
Backward Planning: In scenarios where there’s a fixed project deadline, a Gantt chart facilitates backward planning. By setting the desired end date, the chart helps identify when each task should start to meet the overall project deadline.
Planned Vs Actual: Use colour coding or separate task bars to plot planned task duration against actual duration. This will highlight where most project slippage occurred and make subsequent planning more efficient
Why Gantt Charts are Used
Project Planning: Gantt charts are powerful tools for project planning. They allow project managers to break down a project into manageable tasks, define their dependencies, and establish realistic timelines. This enables teams to have a structured roadmap for project execution.
Resource Allocation: With a Gantt chart, it’s easy to visualize resource requirements for each task. Project managers can allocate resources effectively, preventing bottlenecks and ensuring that the right people are working on the right tasks at the right time.
Timeline Management: Gantt charts provide a visual representation of project timelines. This helps teams and stakeholders understand the critical path of a project, identify potential delays, and take corrective actions to keep the project on track.
How to establish your Gannt Chart
Task Identification: Clearly define and list all tasks necessary for project completion.
Task Duration Estimation: Estimate the time required for each task and represent it with corresponding length bars on the Gantt chart.
Dependency Mapping: Identify task dependencies and establish the sequential order of tasks.
Timeline Setup: Establish a realistic timeline on the Gantt chart, aligning with the project’s overall schedule.
Regular Updates: As the project progresses, regularly update the Gantt chart to reflect actual task completion dates and any changes in dependencies.
Resource Allocation: Gantt charts can also be used for resource management by indicating which resources are assigned to specific tasks at different points in time.
The Advantages of Gantt Charts on Manual Planning Boards:
Overview – View The Big Picture: Manual Gannt planning boards offer a tangible, at-a-glance view of the entire project. Unlike digital alternatives, physical boards allow teams to see the big picture in a centralized location, fostering collaboration and communication.
Quick and Intuitive Updates: Updating a manual Gannt planning board is a straightforward process. Team members can easily add, remove, or adjust tasks without the need for extensive training or navigating through complex software interfaces.
Enhanced Team Collaboration: Manual Gannt planning boards serve as a focal point for team collaboration. Team members can gather around the board, discuss progress, and strategize in real-time, fostering a collaborative environment that may be challenging to achieve with digital tools alone.
Ease of Use in any Environment: When in busy production or industrial environments, a manual Gannt planning board can be referred to, used and updated by any colleague in situ
In Conclusion
In the fast-paced world of project management, where precision and clarity are paramount, Gantt charts on manual planning boards emerge as invaluable assets. Eurocharts’ commitment to providing practical and efficient solutions is exemplified through the incorporation of Gantt chart principles in their planning boards. As we navigate the complexities of project execution, these tangible tools offer a bridge between meticulous planning and successful project completion, fostering a collaborative and informed project environment.
Discover Eurocharts Range Of Manual Gannt Charts and Planning Boards HERE